
Closing line value: a price comparison with limits
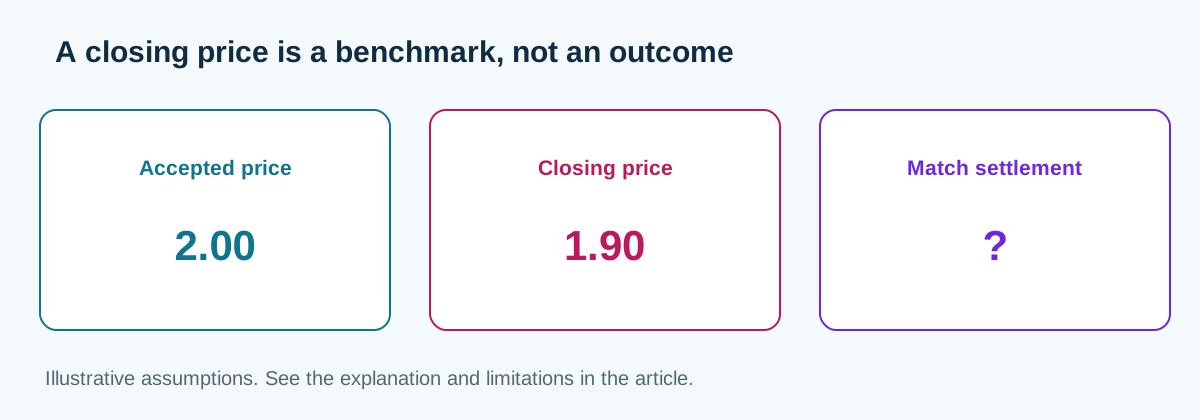
You take a CS2 selection at 1.95. Just before the market closes, the same selection is 1.83 and its opponent is 2.03. Your price improved relative to that closing market. Whether the bet had positive expected value is a different question: it depends on the selection's true probability. Keep those two questions separate in your ledger.
This guide uses hypothetical prices and populations, not an observed esports dataset. The arithmetic can be reproduced; claims about an operator's typical margins, limits, speed or profitability cannot be inferred from these examples. A closing quote is a useful benchmark only when its timestamp, market and settlement rules match the bet being evaluated.
Define the benchmark before measuring it
Record the last available pre-match quote from your chosen reference source, rather than assuming the scheduled start is the close. A match can start late, a bookmaker can suspend early and different markets can close at different times. Save the actual quote timestamp and its status. If the source was already live, do not silently mix that price into a pre-match series.
Compare the same selection and conditions: map winner versus match winner, regulation versus overtime, and the same roster-change and void rules. A higher quote for a differently settled contract is not evidence that one operator mispriced the other. Save both sides of a two-way market so that its overround can be calculated. A single closing price is insufficient for proportional margin removal.
Choose a reference source and de-vig method before inspecting your results. A more liquid quote may be more informative than an isolated thin-market price, but neither liquidity nor a familiar operator name proves calibration. Record available stake and the source's availability rather than assuming every Tier-1 market is efficient or every lower-tier market is unusable.
Calculate CLV without confusing it with overround
Let o be your accepted decimal odds, and let c_A and c_B be the closing quotes for both exhaustive outcomes. Raw additive CLV is o − c_A. Proportional no-vig CLV is o × p_close − 1, where p_close = (1/c_A)/(1/c_A + 1/c_B). It is also o/o_close_fair − 1. State which definition you use; a raw price improvement and a margin-adjusted comparison can have different signs.
q_B = 1/2.03 = 0.4926108374
S = q_A + q_B = 1.0390589249
Overround = S − 1 = 3.905892%
Normalized hold = 1 − 1/S = 3.759067%
p_A = q_A/S = 0.5259067358
Fair odds A = 1/p_A = 1.901477833
Fair odds B = 2.109289617
CLV A at 1.95 = 1.95 × p_A − 1 = +2.551813%
CLV B at 2.20 = 2.20 × (1 − p_A) − 1 = +4.300518%
The two CLV figures are separate hypothetical bets, not a recommendation to hold both sides. Calculate with unrounded values and round only the displayed result. Overround is the excess implied-probability sum; normalized hold is a different transformation. Neither number is the observed loss rate of a bettor, because selections, accepted prices, stakes and actual outcomes matter.
What changes when you change the de-vig method?
Proportional normalization distributes overround proportionally. The Power method instead solves q_A^k + q_B^k = 1. For the same quotes, k = 1.058639157 and the resulting probability for A is 0.5274229210. A numerical solution of the two-outcome Shin equations gives p_A = 0.5269186250. These are model outputs, not three independent observations of the true probability.
| Method | A probability | A fair odds | CLV at 1.95 |
|---|---|---|---|
| Proportional | 52.590674% | 1.901478 | +2.551813% |
| Power | 52.742292% | 1.896012 | +2.847470% |
| Shin | 52.691862% | 1.897826 | +2.749132% |
The difference is specific to these inputs. There is no universal 0.3-point adjustment or universally best method for esports. Keep the method fixed for comparable reports, and show sensitivity when a small apparent advantage changes sign under reasonable assumptions. Do not select the method that makes an already placed bet look best. The odds converter lets you compare the proportional and Shin calculations.
A positive CLV can coexist with negative expected value
Expected net return per unit is EV = o × p_true − 1. CLV substitutes a benchmark probability for the unknown true probability. Their difference is EV − CLV = o × (p_true − p_close). They coincide only when that substitution is justified. Removing overround does not itself justify it, and a positive average price comparison cannot certify the assumption.
For a concrete counterexample, take odds of 1.72 and a hypothetical no-vig close of 1.55. CLV is 1.72/1.55 − 1 = +10.97%. If the true win probability is instead 0.55, expected return is 1.72 × 0.55 − 1 = −5.40%. The bet beats that closing benchmark and still has negative EV. A larger sample does not remove systematic error in the benchmark.
An assumption such as E[p_true − p_close] = 0 is also insufficient by itself when accepted odds vary. Expected-return reasoning needs the appropriately conditioned or stake-weighted error to vanish. Selection rules can correlate your accepted prices with benchmark mistakes. This is one reason to test a model on later, untouched data and to examine calibration rather than treating a strong-looking CLV report as proof.
Sample size: what the arithmetic does and does not establish
Consider an explicit planning example with independent CLV observations, known standard deviation 0.06 and mean 0.04. Requiring the mean to be twice its standard error gives n = (2 × 0.06/0.04)^2 = 9, not 90. This is algebra under assumed parameters. Nine bets do not establish a real betting edge, validate a closing source or guarantee a useful small-sample confidence interval.
For another conditional example, independent one-unit bets at odds 2.00 with true win probability 0.52 have expected profit 0.04 units per bet and standard deviation approximately 1 unit. Across 1,000 such bets, expected profit is 40 units and its standard deviation is about 31.6 units. A normal approximation gives roughly a 10% probability of finishing below the starting balance. This is a model calculation, not a measured esports outcome rate or a prediction for a mixed-odds ledger.
Repeated bets on one team, maps within one series and overlapping tournament outrights can share risk. Their errors need not be independent. Changing patches, rosters, pricing sources or selection rules also changes the process being averaged. Do not import a universal correlation, a fixed number of bets or an “elite” CLV threshold from a hypothetical population.
Build a ledger that preserves the comparison
Keep the accepted price, stake, quote time, game, event, market, selection and settlement definition. Add both closing quotes, reference source, timestamp, de-vig method, resulting benchmark probability and CLV. Record the actual result and net profit separately, including fees and voids. Missing or mismatched closing data should have an explicit status rather than an invented replacement.
For different stake sizes, report both the simple mean and SUM(stake × CLV)/SUM(stake). The latter is a stake-weighted benchmark return, not certified expected profit. Multiplying it by turnover gives money valued against that benchmark. Only under an adequate probability model could that monetary quantity be interpreted as expected value.
Segment by market and selection process so that a format change is visible, but do not repeatedly subdivide a small sample until one segment looks convincing. Establish inclusion rules in advance. Investigate suspicious closing moves and report results with and without flagged observations where relevant; do not delete a large outlier merely because it changes the average.
Use the report to investigate, not to promise profit
A negative comparison may point to late execution, an unsuitable reference or expensive accepted prices. A positive one may reflect information, benchmark error or an inconsistent contract. Recheck the quote history and assumptions before deciding which explanation fits. The guides to liquidity and limits and line shopping describe additional fields to inspect.
Closing prices arrive after the original betting decision. Feeding the known final close into a historical staking rule creates look-ahead bias. Kelly requires an estimate of the selection's probability at the time of the decision; historical CLV can inform validation but is not a substitute for that estimate. Account limits and an apparently attractive quote do not establish the amount of capital that should be risked.
Review CLV alongside calibration, net results, execution costs and exposure. Keep the benchmark definition consistent and document every change. The useful outcome is a reproducible answer to “which price did I accept relative to which later market?”, with the uncertainty about true profitability still visible.